State-of-the-art long reads overlapper-compare
Introduction
In 2017, Chu et la. wrote a review 1 to present and compare 5 long-read overlapping tools, on 4 datasets (including 2 synthetic ones). This paper is very cool and clear. The authors compare overlappers with respect to peak memory, wall clock time, sensitivity and precision. Table 2 from this paper presents sensitivity and precision:

Overlappers show better results on synthetic datasets than on real data. We can observe an important loss of sensitivity: 59.6-83.8% on the Pacbio real dataset, compared to 88.9-92.4% on the simulated data.
So, ok, overlappers dont't achieve perfect sensibility, but do they miss the same overlaps?
Materials & Methods
Datasets
I selected the two real sequencing datasets in Chu et al.1, because they had the highest variance in sensitivity, so we can see the most extreme effects in how long-read overlappers possibly find different overlaps.
What is an overlap
I will not bore you with formal definitions :)
We will consider 3 type of overlaps, according to Algorithm 5 presented in the minimap publication 2
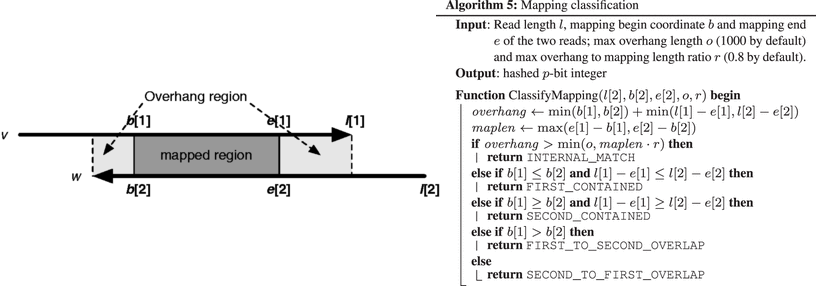
Internal match: : Just a short similarity localized in the middle section of both reads, which is probably due to a repetitive region and not a true overlap
Containment: : One read is completely contained in another
Classic overlap: : Deemed a regular suffix-prefix overlap
We will check the results of overlappers, and for each entry that isn't an internal match nor an containment overlap, we store the pair of reads as elements of the set of all overlaps found by the overlapper.
Overlappers
We used:
We used parameters recommended by Chu et al.1 and default parameters for HISEA.
Venn diagram generation
We used a Python script to parse the output file of each overlapper, filter overlaps, generate a Venn diagram, and compute the Jaccard index. All scripts and steps to reproduce this analysis are available in this repository.
Results
Nanopore real data

In the center of the above diagram we have the number of overlaps found by all overlappers. We call this set the core overlaps. Here for this dataset, core overlaps contain 8,980,212 overlaps. Around this center, we highlight some of the largest disparities between overlappers:
| dataset composition | number of overlaps | % of core overlaps |
|---|---|---|
| core overlaps - hisea overlaps | 898,995 | 10.01 % |
| hisea overlaps $\cap$ mhap overlaps | 464,546 | 5.17 % |
| core overlaps - mhap overlaps | 198,989 | 2.21 % |
| core overlaps - graphmap overlaps | 198,014 | 2.21 % |
In addition, out of the 11,352,915 overlaps found by mhap, 4.96 % of these are found only by this overlapper. For hisea, the corresponding value is 1.55 % (out of 10,114,576 overlaps).
| mhap | minimap2 | graphmap | hisea | |
|---|---|---|---|---|
| mhap | 0.88 | 0.85 | 0.82 | |
| minimap2 | 0.88 | 0.94 | 0.84 | |
| graphmap | 0.85 | 0.94 | 0.83 | |
| hisea | 0.82 | 0.84 | 0.83 |
The above matrix shows the Jaccard similarity coefficient (cardinality of intersection divided by cardinality of union) between pairs of overlappers.
Pacbio real data
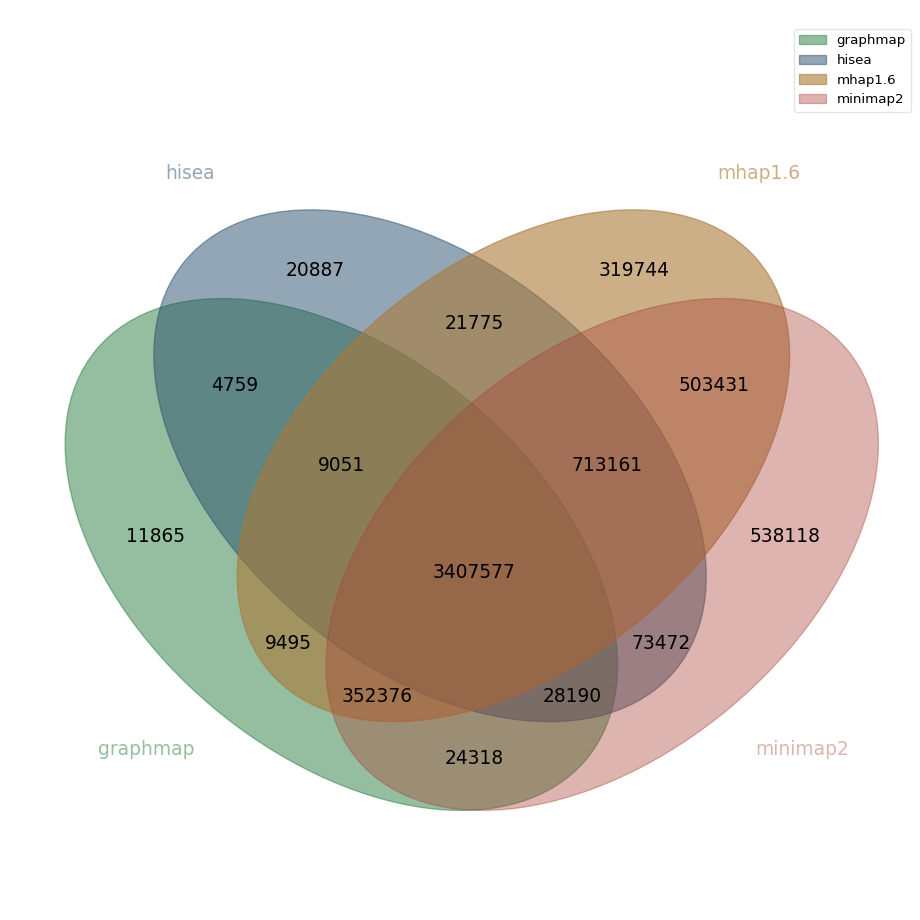
For the Pacbio dataset, core overlaps contain 3,407,577 overlaps. Other large disparities between overlappers are:
| dataset composition | number of overlaps | % of core overlaps |
|---|---|---|
| core overlaps - graphmap overlaps | 713,161 | 20.93 % |
| minimap2-only overlaps | 538,118 | 15.79 % |
| mhap overlaps $\cap$ minimap2 overlaps | 503,431 | 14.77 % |
| core overlaps - hisea overlaps | 352,376 | 10.44 % |
| mhap-only overlaps | 319,744 | 9.38 % |
Out of all overlaps found by minimap2 (5,640,643), 9.54% of these overlaps are found only by this overlapper, for mhap the corresponding value is 5.98% (out of 5,336,610 overlaps).
| mhap | minimap2 | graphmap | hisea | |
|---|---|---|---|---|
| mhap | 0.83 | 0.70 | 0.76 | |
| minimap2 | 0.83 | 0.67 | 0.74 | |
| graphmap | 0.70 | 0.67 | 0.74 | |
| hisea | 0.76 | 0.74 | 0.74 |
Again the above matrix shows Jaccard similarity coefficient.
Comparison across versions
At first we used mhap 2.1, using the same parameters as in Chu et al.1. But actually, Chu. et al used mhap 1.6. This version change yielded surprising results: many more overlaps were found only by mhap 2.1. Here is a comparison between the two executions of mhap 1.6 and 2.1 using the same command-line parameters, in terms of shared and exclusive overlaps.
Jaccard similarity 0.72, 0.26
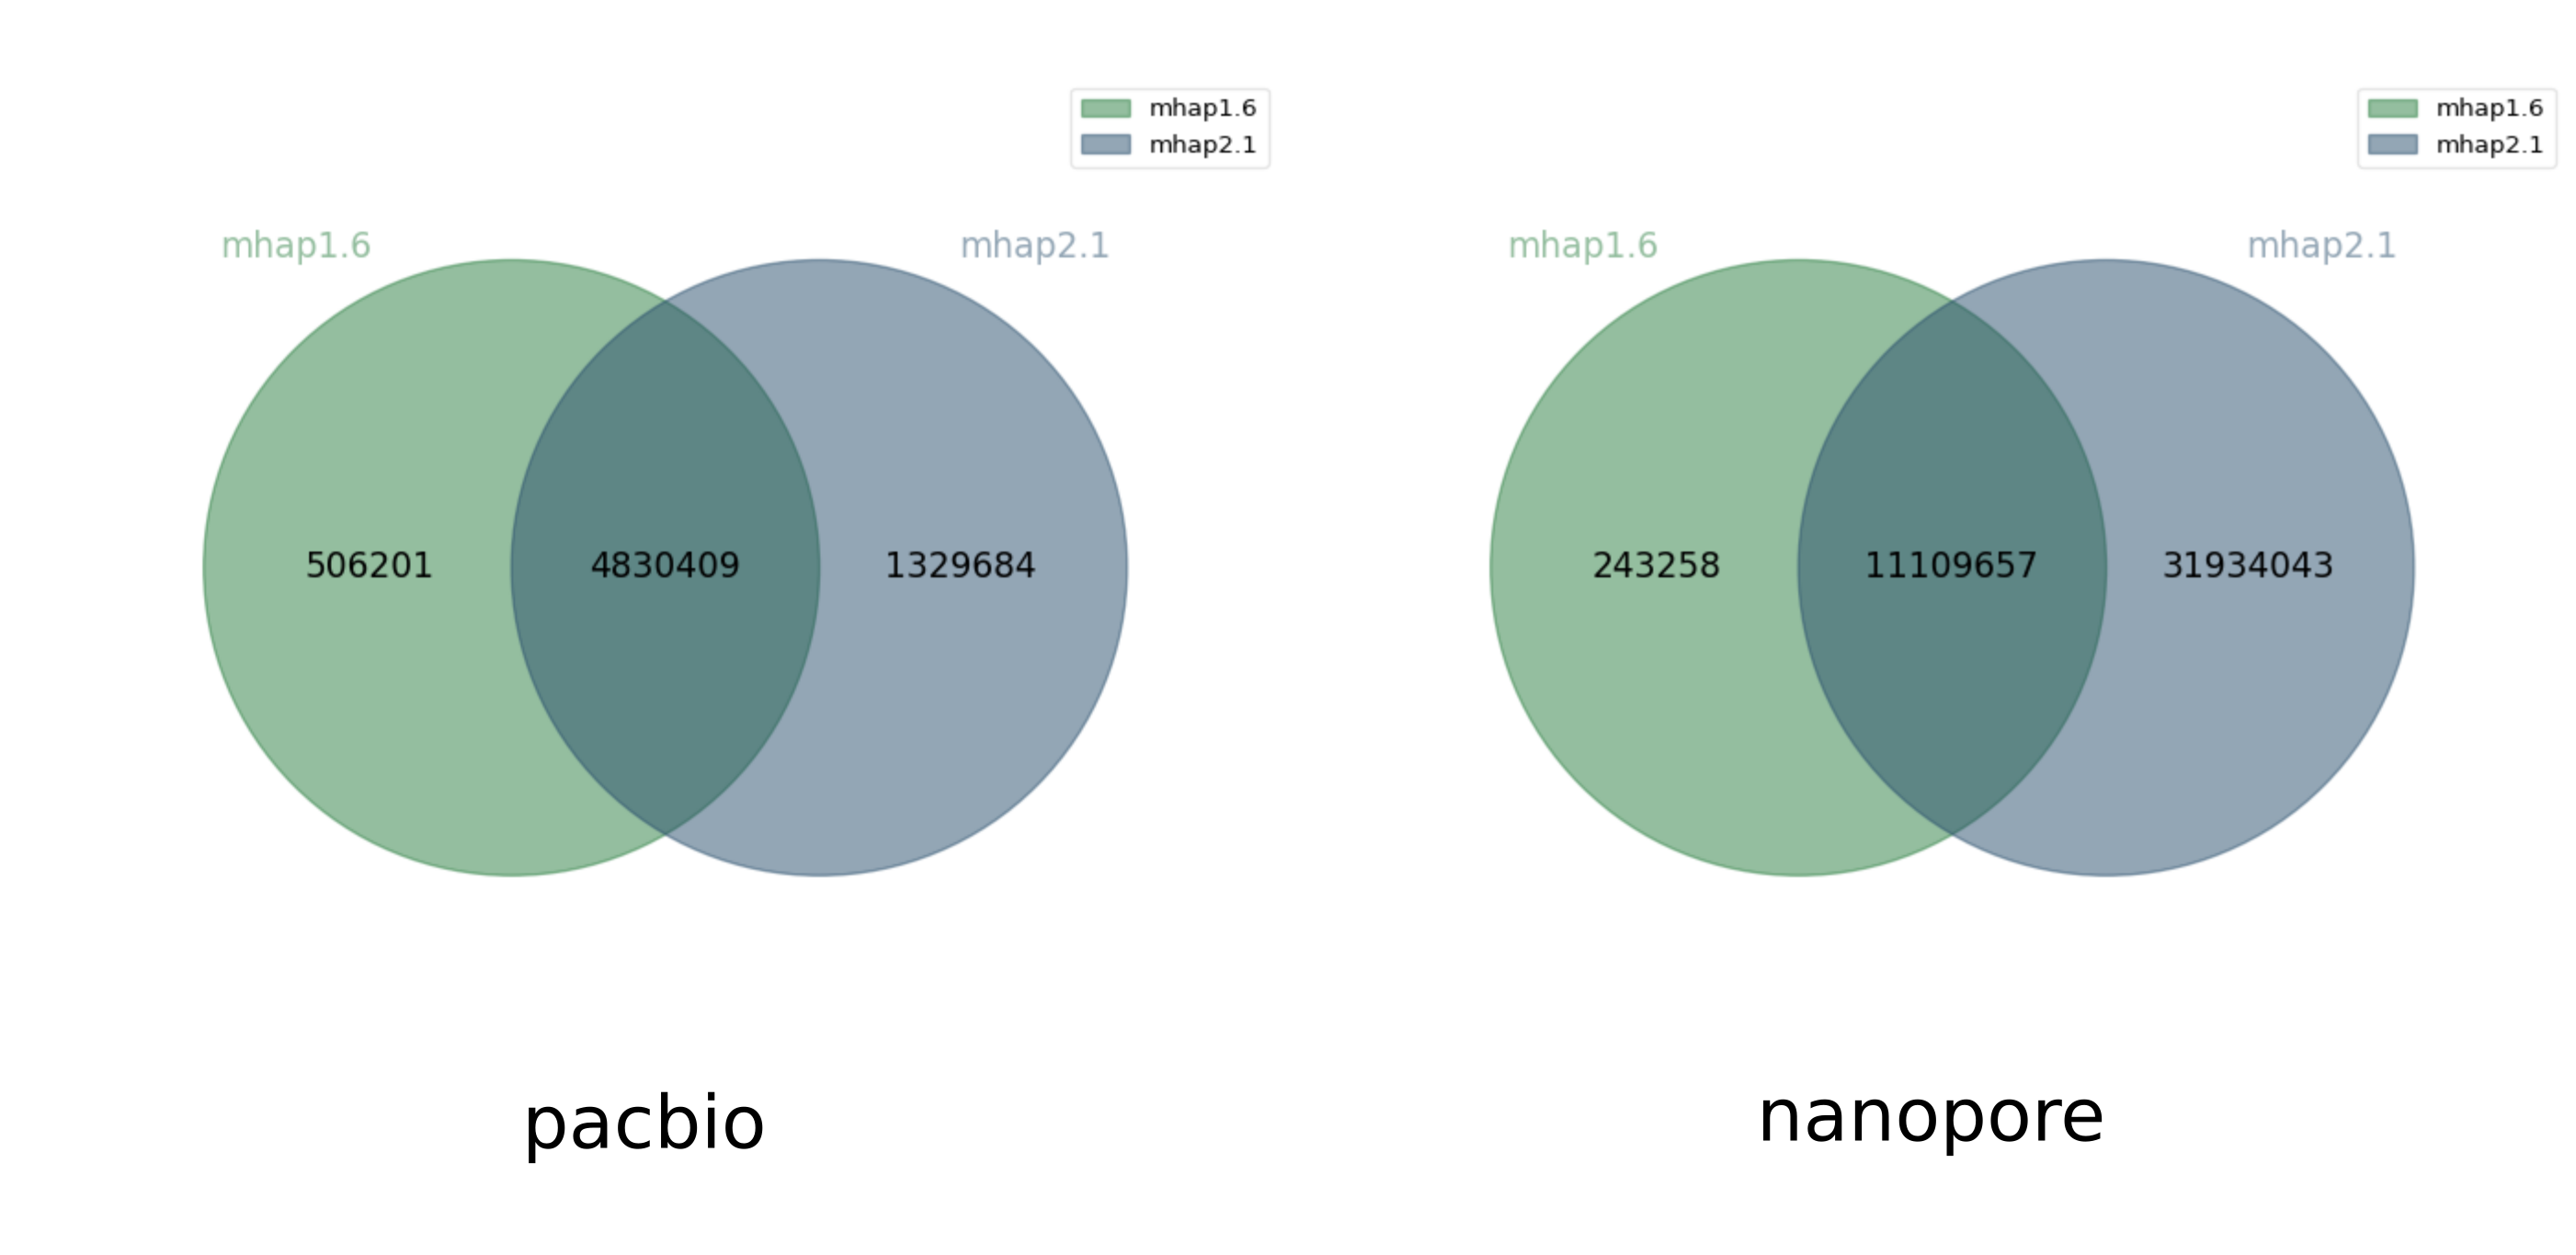
mhap 2.1 found many more overlaps than mhap 1.6. But it turns out that this is because mhap 1.6 calculates a similarity score between reads and mhap 2.1 calculates a distance between reads, the meaning of the --threshold option is different between the two versions, so we should have not used the same parameter value for both versions (thanks to Sergey Koren for pointing this out). This explains why a user may get significantly different results between the two versions, when running them carelessly with identical parameters. Below, we plot the Venn diagrams of overlaps found only by mhap 1.6 with --threshold 0.02 for pacbio and --threshold 0.04 (like Chu. et al) and only by mhap 2.1 with --threshold 0.75 for pacbio and --threshold 0.78 for nanopore.
Jaccard similarity 0.84, 0.96
Both software find roughly the same set of overlaps, with the trend that mhap1.6 tended to find a bit more (it would be interesting to evaluate whether those were correct or wrong overlaps).
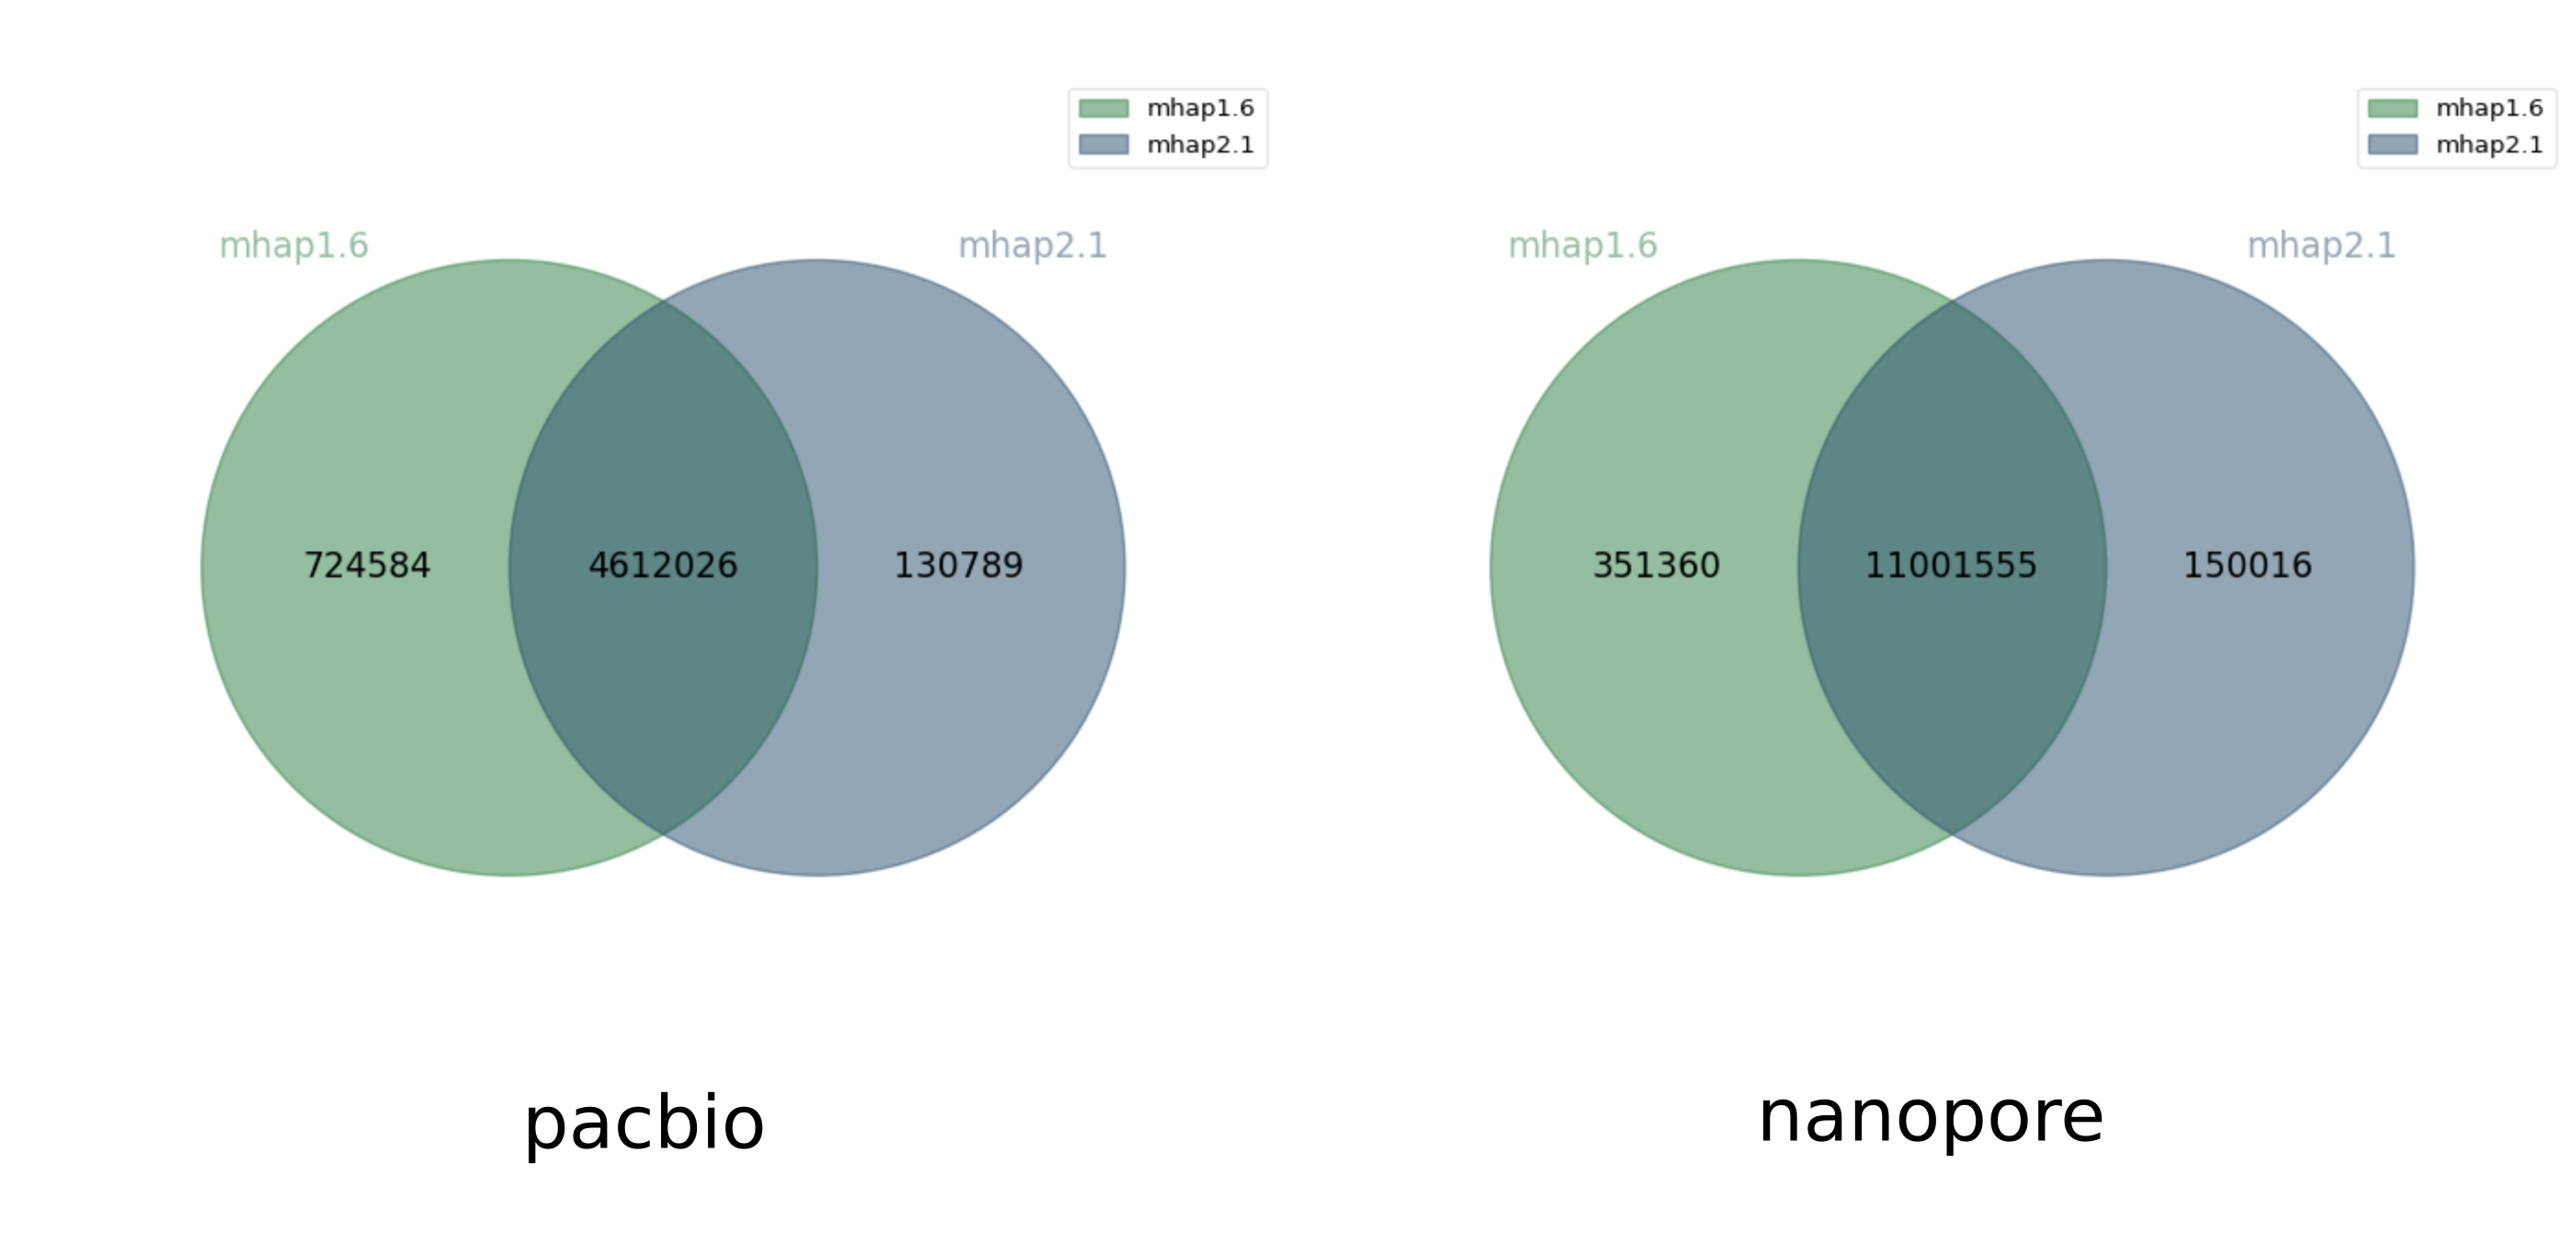
And another comparison between minimap and minimap2:
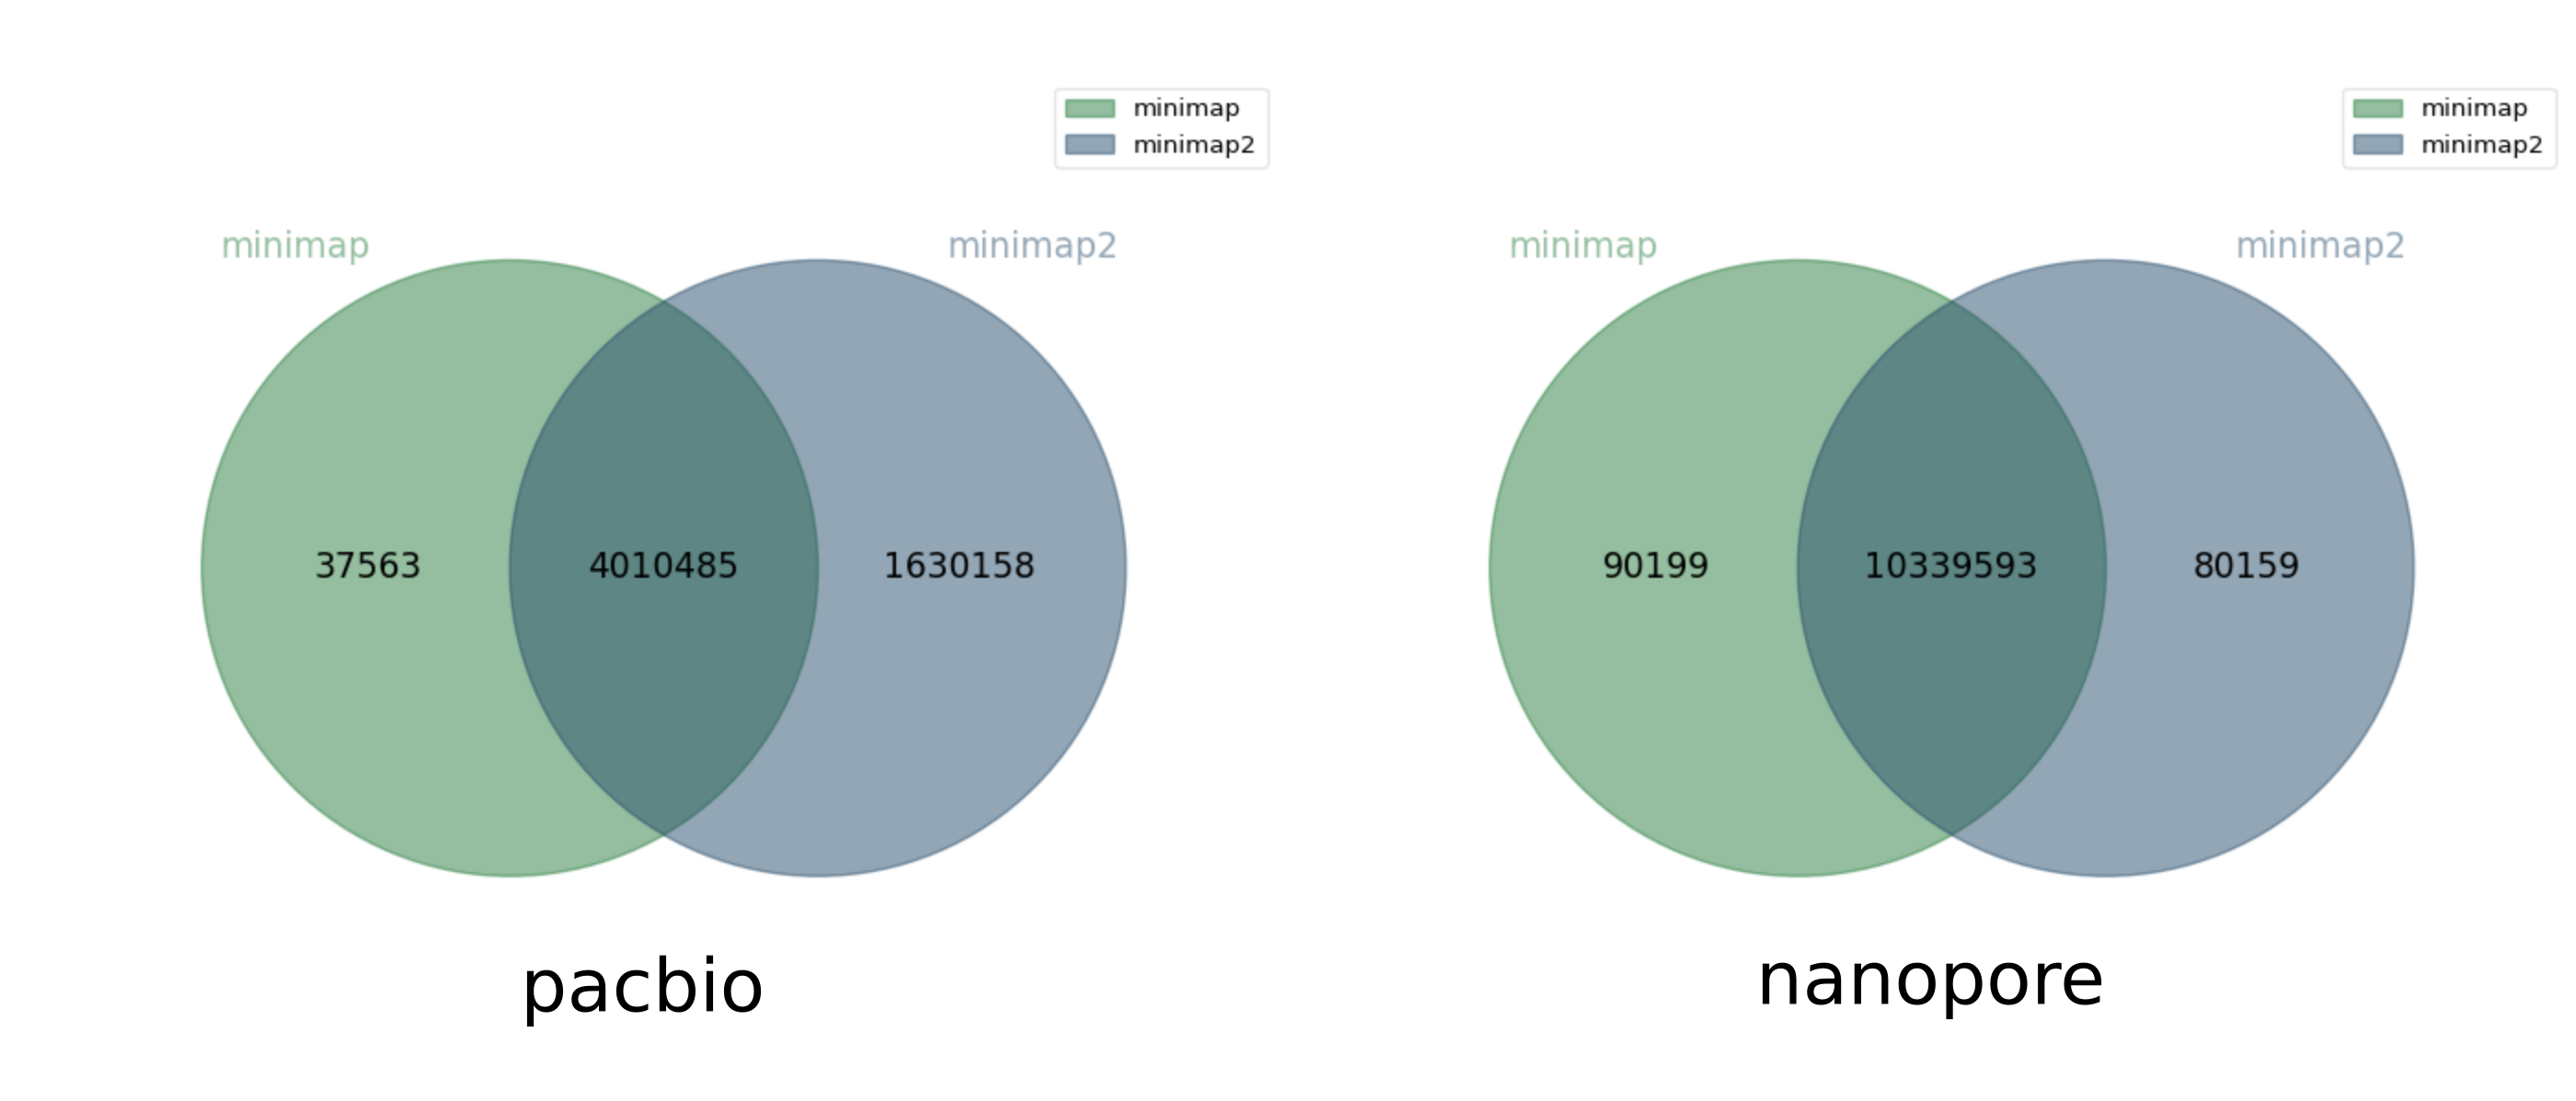
Jaccard similarity 0.71, 0.98
For the pacbio dataset, minimap2 finds significantly (1.6M) more overlaps than minimap (which found 4M overlaps). But for the nanopore dataset, both software roughly agree.
Conclusion
Overlapper tools behave quite similarly, but on real pacbio datasets1, sensibility, precision, and the set of overlaps found across tools can be very different. Such a difference can also exist between two versions of the same tool.
Comparison of overlappers based on a quantitative measurement (sensitivity, precision) is useful but isn't perfect: two tools with the same sensitivity for a given set could still detect a different set of overlaps, see e.g. mhap and minimap2 for the nanopore set.
Some publications use quality of error-correction, or results of genome assembly, as quality metrics to compare overlappers. It's a good idea but correction and assembly tools make additional choices in the overlaps they keep, and it's not easy to relate assembly or error-correction imperfections and wrong or missed overlaps.
From our tests, there is no clear best overlapper software so far.
It could by interesting to study whether certain tools have a bias when finding overlaps, linked to e.g length of reads, mapping length, error rate, %GC, specific kmer composition, etc … A study like this could possibly reveal some intrinsic properties of the algorithms used in overlappers.
Is it a good idea to create a reconciliation tool for overlappers? We note that the correction and assembly tools seek to reduce the amount of overlaps they use, through e.g. graph transitivity reduction, Best Overlap Graph, the MARVEL approach7.
Acknowledgment
- Sergey Koren
- Rayan Chikhi
- Jean-Stéphane Varré
Reference
Innovations and challenges in detecting long read overlaps: an evaluation of the state-of-the-art by Chu et al. doi:10.1093/bioinformatics/btw811
Minimap and miniasm: fast mapping and de novo assembly for noisy long sequences by Heng Li doi:10.1093/bioinformatics/btw152
Fast and sensitive mapping of nanopore sequencing reads with GraphMap by Sovic et al. doi:10.1038/ncomms11307
HISEA: HIerarchical SEed Aligner for PacBio data by Khiste and Ilie doi:10.1186/s12859-017-1953-9
Assembling large genomes with single-molecule sequencing and locality-sensitive hashing Berlin et al. doi:10.1038/nbt.3238
Minimap2: pairwise alignment for nucleotide sequences by Li et al. arxiv
Supplementary information of The axolotl genome and the evolution of key tissue formation regulators by Nowoshilow et al. doi:10.1038/nature25458